
用Python进行数据分析的好处是,它的数据分析库目前已经很全面了,有NumPy、pandas、SciPy、scikit-learn、StatsModels,还有深度学习、神经网络的各类包。基本上能满足大部分的企业应用。
而且Python是数据抽取、数据收集整理、数据分析挖掘、数据展示,都可以在同一种Python里实现,避免了开发程序的切换。
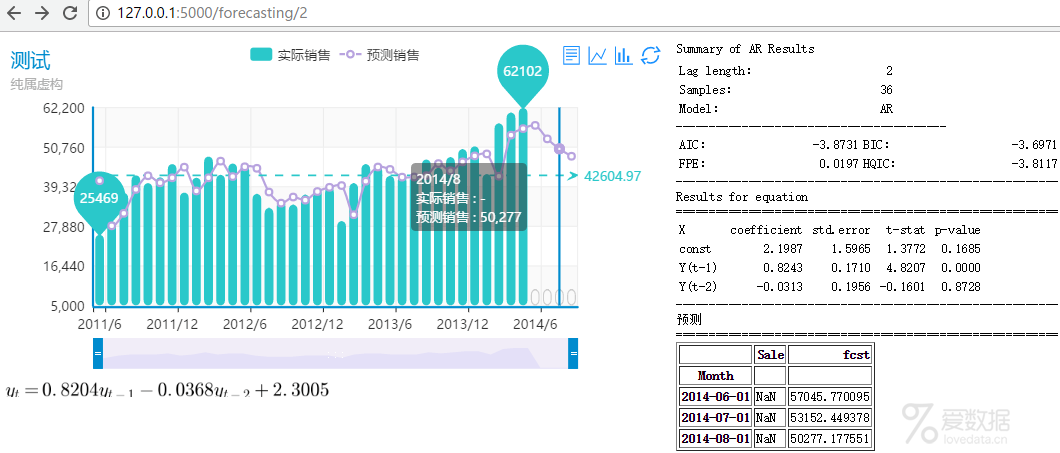
这里就和大家分享我做的一个应用实例。解决问题:自动进行销售预测,提高准确率,减少人工一个一个SKU进行预测分析。最终的效果如下图:
一.用到的工具
当然我们只需要用Python和一些库就可以了。
pandas:数据整理
numpy:pandas的前提,科学计算
MySQLdb:mysql数据库链接
statsmodels:统计建模
pylab:图形处理
flask:web框架
二.Flask的安装
在Flask的app目录下建立一个forecasting.py的python文件,在Flask的app的templates目录下建立一个forecastin.html的模版文件,两个文件的内容如下:
forecasting.py
# -*- coding: utf-8 -*-
from app import app
from flask import render_template
@app.route("/forecasting/")
def forecasting(item=None):
return render_template("forecasting.html")
forecastin.html
<!doctype html>
<title>Hello World</title>
Hello World
在DOS窗口运行
python d:pyflaskrun.py
在浏览器打开http://127.0.0.1:5000/就可以看到forecasting.html模版的内容显示了。

接下来我们从头建一个预测模型。
三.建立数据库并填写数据
CREATE TABLE [Math Processing Error] (
[Math Processing Error] datetime DEFAULT NULL,
[Math Processing Error] float DEFAULT NULL
) ENGINE=InnoDB DEFAULT CHARSET=utf8;
数据自己录入啦。
四.相关库的引入
我们现在在之前第2点建立的文件的基础上进行修改,
在forecasting.py的头部引入以下库
# -*- coding: utf-8 -*-
from app import app
from flask import render_template
import pylab
import pandas as pd
import numpy as np
from pandas import Series,DataFrame
import MySQLdb
import pandas.io.sql as sql
import statsmodels.api as sm
import time
import datetime
from dateutil.relativedelta import relativedelta
import random
五.定义路由
@app.route("/forecasting/<int:lag>")
意思就是我们访问例如http://127.0.0.1:5000/forecasting/2的地址对于就是解析到forecasting.py文件,其中<int:lag>是可变的URL部分,如上面的URL的2
六.定义函数
def forecasting(lag=None):
其中lag就是接受URL中的参数,我们定义lag是自回归函数的滞后期数。
七.数据库连接
conn = MySQLdb.connect(host="127.0.0.1",user="root",passwd="123456",db="bi",charset="utf8")
str_sql = "select SaleMonth as Month,Sale from sale order by SaleMonth"
sale=sql.read_sql(str_sql,conn)
八.数据处理
我们整理数据以适合使用。
##//数据处理
#转换数据中的月份为日期类型,并把它定义为pandas索引
sale.Month = pd.to_datetime(sale.Month)
sale = sale.set_index("Month")
##//提取最大月份和最小月份
start = min(sale.index)
end = max(sale.index)
##定义预测的月份,在最大月份的基础上加1-4
pre_start =end+relativedelta(months=1)
pre_end =end+relativedelta(months=4)
#必要的转换
pre_start =pre_start.strftime("%Y-%m-%d")
pre_end =pre_end.strftime("%Y-%m-%d")
#生成时间序列,从最小月份到最大月份
i = pd.date_range(start, end, freq="MS")
df = DataFrame(i,i)
#定义列、定义索引index名
df.columns = ["T"]
df.index.names =["Month"]
#把sale与df合并,通过索引
rs = pd.merge(sale,df,left_index=True,right_index=True,how="outer")
#删除临时列T,并把rs转换为html,方便后面输出到模版中
del rs["T"]
data = rs.to_html()
九.数据预测
##预测
#对rs进行对数变换
rs = np.log(rs)
#对rs进行自回归,lag是自回归的滞后因子,来自函数的lag参数,即来自RUL的参数
r = sm.tsa.AR(rs).fit(maxlag=lag, method="mle", disp=-1)
#对未来四个月进行预测
fcst_lg = r.predict(start,pre_end)
#对预测的结果进行指数变换,因为之前做了对数变换
fcst = np.exp(fcst_lg)
#转换fcst为pandas的DataFrame格式
fcst = DataFrame(fcst)
#定义列名和索引,用于和原来的rs合并
fcst.columns=["fcst"]
fcst.index.names =["Month"]
#合并fcst和rs到rs_out
rs_out = pd.merge(sale,fcst,left_index = True,right_index = True,how="outer")
#rs_out转换为记录格式,再转换为html格式,以方便输出到模版中显示
#取得最后的4行作为预测的显示输出,不知道为什么rs_out[-4:-1]这个输出漏了最后一行
rs_fcst = rs_out[-4:-1]
rs_fcst = rs_fcst.to_html()
rs2 = rs_out.to_records()
rs_out = rs_out.to_html()
十.数据整理
我使用了echart web图标框架进行显示。
##以下是处理表格数据输出到echart的json格式
tmp=u"<chart caption="销售及预测拟合" subcaption="过去所有数据" xaxisname="月份" yaxisname="销售/预测" theme="fint">"
tmp1=""
tmp2=""
tmp3=""
for t in rs2:
#tmp1 += "{"label":"" + str(t.Month.year)+"/"+str(t.Month.month) + "","value":"" + str(t.Qty) + ""},"
#tmp1 += "<category label=""+str(t.Month.year)+"/"+str(t.Month.month)+"" />"
tmp1 += """+str(t.Month.year)+"/"+str(t.Month.month)+"","
#tmp2 += "<set value=""+ str("%.2f" % t.Sale) +"" />"
tmp2 += str("%.0f" % t.Sale) +","
#tmp3 += "<set value=""+ str("%.2f" % t.fcst) +"" />"
tmp3 += str("%.0f" % t.fcst) +","
tmp +="<categories>"+tmp1+"</categories>"
tmp +=u"<dataset seriesname="销售">"+tmp2+"</dataset>"
tmp +=u"<dataset seriesname="预测" renderas="line" showvalues="0">"+tmp3+"</dataset>"+"</chart>"
tmp1 = tmp1[:-1]
tmp2 = tmp2[:-1]
tmp2 = tmp2.replace("nan",""-"")
tmp3 = tmp3[:-1]
tmp=u"""{
title : {text: "测试",subtext: "纯属虚构"},
tooltip : {trigger: "axis"},
legend: {data:["实际销售","预测销售"]},
toolbox: {
show : true,
feature : {
mark : {show: false},dataView : {show: true, readOnly: false},
magicType : {show: true, type: ["line", "bar"]},
restore : {show: true},saveAsImage : {show: false}
}
},
calculable : true,
dataZoom : {show : true,realtime : true,start : 0,end : 100},
xAxis : [{type : "category",data : [%s]}],
yAxis : [{type : "value",min : 5000,scale : true}],
series : [
{
name:"实际销售",type:"bar",data:[%s],
markPoint : {
data : [{type : "max", name: "最大值"},{type : "min", name: "最小值"}]
},
markLine : {data : [{type : "average", name: "平均值"}]}
},
{
name:"预测销售",type:"line",data:[%s],
}
]
};""" %(tmp1,tmp2,tmp3)
十一.生成公式
生成一个公式能更直观显示变量之间的关系。
#生成动态公式图片
rp = r.params
ftext=""
i=0
for rp1 in rp:
if (i==0) and (rp1>0) :const = "+" + str(("%.4f" % rp1))
if (i==0) and (rp1<0) :const = str(("%.4f" % rp1))
if (i==1):ftext = ftext + str(("%.4f" % rp1))+"y_{t-"+str(i)+"}"
if (i>1) and (rp1>0):ftext = ftext + "+" + str(("%.4f" % rp1))+"y_{t-"+str(i)+"}"
if (i>1) and (rp1<0):ftext = ftext + str(("%.4f" % rp1))+"y_{t-"+str(i)+"}"
i +=1
f = r"$y_{t}="+ftext+const + "$"
f2 = r"$y=ln(w_{t})$"
fig = pylab.figure()
#设置背景为透明
fig.patch.set_alpha(0)
text = fig.text(0, 0, f)
# 把公式用公式图片的方式保存
dpi = 300
fig.savefig("d:/py/formula.png", dpi=dpi)
# Now we can work with text"s bounding box.
bbox = text.get_window_extent()
width, height = bbox.size / float(dpi/4) + 0.005
# Adjust the figure size so it can hold the entire text.
fig.set_size_inches((width, height))
# Adjust text"s vertical position.
dy = (bbox.ymin/float(dpi))/height
text.set_position((0, -dy))
# Save the adjusted text.
url = "D:/py/Flask/app/static/images/1.png"
fig.savefig(url, dpi=dpi)
十二.输出到模板
把py程序中的在模版中用到的结果输出到模版。
#生成动态公式图片
rp = r.params
ftext=""
i=0
for rp1 in rp:
if (i==0) and (rp1>0) :const = "+" + str(("%.4f" % rp1))
if (i==0) and (rp1<0) :const = str(("%.4f" % rp1))
if (i==1):ftext = ftext + str(("%.4f" % rp1))+"y_{t-"+str(i)+"}"
if (i>1) and (rp1>0):ftext = ftext + "+" + str(("%.4f" % rp1))+"y_{t-"+str(i)+"}"
if (i>1) and (rp1<0):ftext = ftext + str(("%.4f" % rp1))+"y_{t-"+str(i)+"}"
i +=1
f = r"$y_{t}="+ftext+const + "$"
f2 = r"$y=ln(w_{t})$"
fig = pylab.figure()
#设置背景为透明
fig.patch.set_alpha(0)
text = fig.text(0, 0, f)
# 把公式用公式图片的方式保存
dpi = 300
fig.savefig("d:/py/formula.png", dpi=dpi)
# Now we can work with text"s bounding box.
bbox = text.get_window_extent()
width, height = bbox.size / float(dpi/4) + 0.005
# Adjust the figure size so it can hold the entire text.
fig.set_size_inches((width, height))
# Adjust text"s vertical position.
dy = (bbox.ymin/float(dpi))/height
text.set_position((0, -dy))
# Save the adjusted text.
url = "D:/py/Flask/app/static/images/1.png"
fig.savefig(url, dpi=dpi)
十三.设计模板
我们可以用{{变量名}}来接受来自py程序的变量。
<!doctype html>
<title>分析结果</title>
<script type="text/javascript" src="{{url_for("static", filename="ECharts/doc/asset/js/esl/esl.js")}}"></script>
<script type="text/javascript">
// 路径配置
require.config({
paths:{
"echarts" : "/static/ECharts/build/echarts",
"echarts/chart/bar" : "/static/ECharts/build/echarts",
"echarts/theme/macarons":"/static/ECharts/src/theme/macarons",
}
});
require(
[
"echarts",
"echarts/theme/macarons",
"echarts/chart/bar", // 使用柱状图就加载bar模块,按需加载
"echarts/chart/line" // 使用柱状图就加载bar模块,按需加载
],
function (ec,theme) {
// 基于准备好的dom,初始化echarts图表
var myChart = ec.init(document.getElementById("main"),theme);
var option = {{tmp | safe}}
myChart.setOption(option);
}
);
</script>
<style>
.right{text-align: right}
body{font-size: 12px;background:white}
</style>
<div style="width:970px;">
<div id="main" style="float:left;height:300px;width:600px;"></div>
<div style="float:left;height:300px;width:350px;margin-left:10px;">
Summary of AR Results
<table border=0 style="width:200px">
<tr>
<td colspan=2></td>
</tr>
<tr>
<td>Lag length:</td>
<td class="right">{{r.k_ar}}</td>
</tr>
<tr>
<td>Samples:</td>
<td class="right">{{r.nobs}}</td>
</tr>
<tr>
<td>Model:</td>
<td class="right">AR</td>
</tr>
</table>
-----------------------------------------<br>
<table border=0 style="width:350px">
<tr>
<td>AIC:</td>
<td class="right">{{"%.4f" % r.aic}}</td>
<td>BIC:</td>
<td class="right">{{"%.4f" % r.bic}}</td>
</tr>
<tr>
<td>FPE:</td>
<td class="right">{{"%.4f" % r.fpe}}</td>
<td>HQIC:</td>
<td class="right">{{"%.4f" % r.hqic}}</td>
</tr>
</table>
----------------------------------------------------------<br>
Results for equation<br>
==========================================================<br>
<table border=0 style="width:280px">
<tr style="border-bottom:1px solid red">
<td>X</td>
<td class="right">coefficient</td>
<td class="right">std.error</td>
<td class="right">t-stat</td>
<td class="right">p-value</td>
</tr>
{% for i in range(lag+1) %}
<tr>
{% if i==0 %}
<td>const</td>
{% else %}
<td>Y(t-{{i}})</td>
{% endif %}
<td class="right">{{"%.4f" % r.params[i]}}</td>
<td class="right">{{"%.4f" % r.bse[i]}}</td>
<td class="right">{{"%.4f" % r.tvalues[i]}}</td>
<td class="right">{{"%.4f" % r.pvalues[i]}}</td>
</tr>
{% endfor %}
</table>
----------------------------------------------------------<br>
预测<br>
==========================================================<br>
{{rs_fcst | safe}}
</div>
</div>
<div style="width:970px;margin-bottom:10px;">
<img height=24 src = "../../../static/images/1.png?"><br>
十四.实际应用
在这个例子中,我们只是对一个产品、一个模型、一个参数进行了预测。
在实际应用中,可以批量对产品、多个模型、多种参数进行预测,写一个判定预测模型好坏的算法,自动确定每种产品的最优模型和参数,定期自动计算各产品的预测值。
希望这个思路能帮到大家。
End.
作者:梁斌炜
来源:http://www.statr.cn/?p=205
本文为转载分享,如侵权请联系后台删除
- 我的微信公众号
- 微信扫一扫
-

- 我的微信公众号
- 微信扫一扫
-


评论